Table of Contents
Cardiac Index Overview
The cardiac index is one way to assess heart function. The cardiac index is based on another critical parameter, cardiac output, and converts the cardiac output into a normalized value that accounts for the patient’s body size. An individual weighing 120 pounds, for example, would have a different cardiac output than a person weighing 220 pounds. As a result, a simple cardiac output cannot be used to predict cardiac activity. Calculating a cardiac index will assist in resolving this problem. The cardiac index equation is shown below, with units of (liters/minute)/(meter2).
The human heart is one of the most studied and important organs in the body. There are several ways to explain the current state of the heart’s function and wellbeing. The cardiac index is the best way of explaining that.
Cardiac Index = Cardiac Output / Body Surface Area
= (Heart Rate × Stroke Volume) / Body Surface Area
Experiments have shown that cardiac production increases roughly in proportion to body surface area.
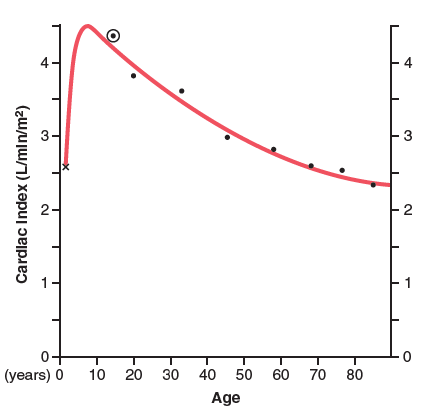
As a result, cardiac output is often expressed in terms of the cardiac index, or cardiac output per square meter of body surface area. The average human being weighing 70 kilograms has a body surface area of approximately 1.7 square meters, implying that the standard average cardiac index for adults is approximately 3 L/min/m2 of body surface area.
Functions of Cardiac Index
The cardiac index’s purpose is to generate a normalized value for the cardiac function that effectively corrects the patient’s body size. The heart’s aim is to keep blood flowing at a sufficient rate to satisfy the body’s current metabolic demand. The cardiac output varies according to body size and level of operation. In general, a typical range for resting cardiac production is between 4.0 and 8.0 L/min, with an average of 5 L/min. Elite athletes can achieve a cardiac output of up to 40 L/min during exercise. The normal cardiac index should be between 2.5 and 4.0 L/min/m2. A value less than 2.0 could increase the possibility of cardiogenic shock (defined as 2.2 L/min/m2 with support or 1.8 L/min/m2 without support).
So, it’s clear that the cardiac index depends on mainly 2 Variables.
- Cardiac Output
- Body Surface Area
So, We have to know every detail about Cardiac Output to clear our concept on Cardiac Index.
Cardiac Output
Cardiac output is the amount of blood pumped into the aorta by the heart each minute. This is also the amount of blood that flows into the circulatory system. Cardiac output is one of the most important things to remember when it comes to circulation since it represents the amount of blood flows to all tissues in the body.
The amount of blood flowing from the veins into the right atrium each minute is referred to as the venous return. Except for a few heartbeats when blood is temporarily deposited in or withdrawn from the heart and lungs, the venous return and cardiac output must be identical.
Normal Values of Cardiac Output
Cardiac function varies greatly depending on the level of activity in the body. Among other things, the following factors have a direct impact on cardiac output:
- The basic degree of body metabolism,
- Whether the person is exercising or not,
- The person’s age, and
- The size of the human body.
Resting cardiac output for young, healthy men is around 5.6 L/min. This value is approximately 4.9 L/min for women. When the factor of age is taken into account—because, with rising age, body activity and the mass of certain tissues (e.g., skeletal muscle) decrease—the average cardiac output for the resting adult is sometimes stated in round numbers to be about 5 L/min.
The cardiac index quickly increases to more than 4 L/min/m2 at age 10 and then falls to about 2.4 L/min/m2 at age 80.
Read Cardiac Glycosides
Effect of Venous Return on Cardiac Output
When it has been said that cardiac output is regulated by venous return, it means that the heart is not the primary controller of cardiac output. Instead, the primary regulators are the different peripheral circulation factors that influence the flow of blood into the heart from the veins, known as the venous return.
Peripheral factors that are typically so critical in regulating cardiac output is that the heart has a built-in system that normally enables it to pump whatever amount of blood flows into the right atrium from the veins automatically. This mechanism is known as the Frank-Starling rule of the heart. This rule basically states that as more blood flows into the heart, the additional blood stretches the walls of the heart chambers. The cardiac muscle contracts with stronger power as a result of the stretch, and this action empties the excess blood that has entered from the systemic circulation.
As a result, blood that enters the heart is instantly pumped without delay into the aorta and circulated again.
Another important aspect is that expanding the heart allows it to pump faster, resulting in a higher heart rate. That is, stretching the sinus node in the right atrial wall has a direct effect on the rhythmicity of the node, raising the heart rate by 10 to 15%. Furthermore, the stretched right atrium causes a nervous reflex known as the Bainbridge reflex, which travels from the vasomotor centre of the brain to the heart through the sympathetic nerves and vagi, increasing heart rate.
Most regular, unstressed conditions regulate cardiac output primarily through peripheral factors that determine the venous return. However, if the returning blood exceeds the capacity of the heart to pump, the heart becomes the limiting factor that decides cardiac output.
Read Sex BP – Sex difference in blood pressure
Cellular Control on Cardiac Output
Cardiac output (CO) is the product of stroke volume (SV), which is the amount of blood ejected by one pulse, and heart rate (HR), which is the number of heartbeats per minute. Specifically, this is a measure of left ventricular output and a clinical predictor of left ventricular activity. As a result, conditions that affect heart rate or stroke volume have a direct impact on cardiac output. Heart rate is affected by various factors, including neuronal and hormonal feedback (e.g., norepinephrine, epinephrine, acetylcholine, thyroid-stimulating hormone), ion concentrations (e.g., Ca2+, K+), core temperature, chemoreception (i.e., blood oxygen concentrations, blood CO2 levels, and pH), and medications (e.g., beta-blockers, muscarinic antagonists, digitalis), among others. Three factors influence stroke volume: contractility, afterload, and preload (remember the mnemonic SV CAP for Stroke Volume affected by Contractility, Afterload, and Preload).
Changes in autonomic nerve activity or myocardial stretch affect cardiac function at the cellular level, though by slightly different mechanisms. To increase the heart rate, the autonomic nervous system raises sympathetic innervation and decreases vagal tone to the sinoatrial node. Sympathetic fibers also have a strong effect on the adrenal medulla, which activates the catecholamines epinephrine and norepinephrine (mostly). These neuronal and hormonal catecholamines function on the heart’s B1-adrenergic receptors, increasing contractility and heart rate.
Discrete increases in myocardium stretch or pre-load often improve cardiac output by enhancing the myofibril-Ca2+ binding relationship. The word “pre-load” refers to the temporal relationship of being “pre” myocardium contraction. That is the load put on the heart when in diastole, or its filling time. Specifically, it is assumed that stretching the muscle fibers increases troponin’s affinity for Ca2+ and decreases the distance between thick and thin filaments of the cardiac muscle – thereby contributing to an increase in the number of cross-bridges that can form. This raises stroke volume and, as a result, cardiac output. The precise underlying mechanism is still being debated.
The afterload, which is aptly named due to its temporal association with the heartbeat, is another variable that can have a significant impact on cardiac output. Afterload is described as the load against which the heart must pump, or, to put it another way, the pressure in the aorta that the heart must overcome in order to expel its left ventricular volume, or preload. Clinical situations where afterload is increased include hypertension and aortic valve stenosis. As afterload increases, stroke volume decreases (in contrast, an increase in contractility or preload results in increased stroke volume).
Relation of Cardiac Output with Peripheral Resistance
As long as the arterial pressure remains constant, the long-term cardiac output level varies reciprocally with shifts in total peripheral vascular resistance. It is worth mentioning that when total peripheral resistance is exactly normal (at the 100% mark in the figure), cardiac output is also normal. As total peripheral resistance rises above average, cardiac output falls; conversely, when total peripheral resistance falls, cardiac output rises. This phenomenon is easily understood by revisiting one of the types of Ohm’s law.
Cardiac Output = Arterial Pressure/ Total Peripheral Resistance
As a result, whenever the long-term degree of total peripheral resistance shifts (but no other functions of the circulation change), cardiac output changes quantitatively in the opposite direction.
Organ Systems Involved with Cardiac Index
- Mainly the heart and,
- The autonomic nervous system
- The endocrine system
- The vascular system
Tests for Cardiac Index
Cardiac Output
In animal studies, the aorta, pulmonary artery, or great veins entering the heart can be cannulated and the cardiac output measured using a flowmeter. To test cardiac output, an electromagnetic or ultrasonic flowmeter may be mounted on the aorta or pulmonary artery.
Except in rare cases, cardiac output is measured in humans using indirect methods that do not require surgery.
Two of the approaches that have been used for experimental studies are the oxygen Fick process and the indicator dilution method.
Echocardiography, a procedure that uses ultrasound waves from a transducer mounted on the chest wall or passed through the patient’s esophagus to determine the size of the heart’s chambers as well as the velocity of blood flowing from the left ventricle into the aorta, can also estimate cardiac output. The velocity of blood flowing into the aorta is used to calculate stroke volume, and the aorta cross-sectional area is determined by ultrasound imaging of the aorta diameter. Cardiac output is then determined by multiplying the stroke volume by the heart rate.
Measuring CO by Oxygen Fick Principle
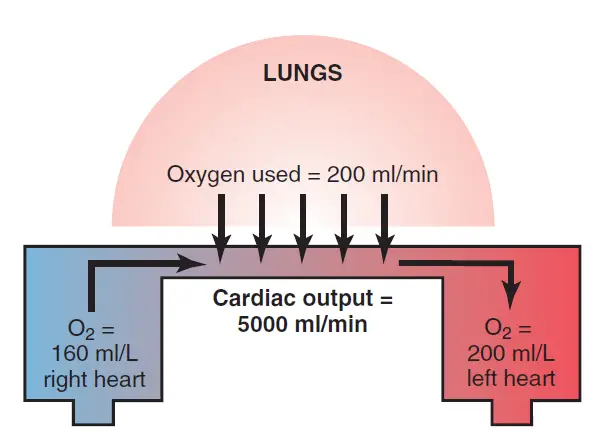
This model represents the absorption of 200 milliliters of oxygen from the lungs into the pulmonary blood every minute. It also demonstrates that the blood entering the right heart has an oxygen concentration of 160 mL/L, while the blood leaving the left heart has an oxygen concentration of 200 mL/L. Based on these figures, each liter of blood flowing through the lungs consumes 40 milliliters of oxygen.
Since the total amount of oxygen absorbed into the blood from the lungs is 200 milliliters per minute, dividing 200 by 40 yields a total of five 1-liter portions of blood that must travel through the pulmonary circulation each minute to consume this amount of oxygen. As a result, the amount of blood flowing through the lungs every minute is 5 liters, which is also a measure of cardiac output.
By following the principle the calculation of CO is;
Cardiac Output(L) = O2 absorbed per minute by the lungs (ml/min)/ Arteriovenous O2 difference(ml/L of blood)
Mixed venous blood is normally collected through a catheter inserted up the brachial vein of the forearm, through the subclavian vein, down to the right atrium, and eventually through the right ventricle or pulmonary artery by using this Fick technique to measure cardiac output in humans. Any systemic artery in the body can then be used to receive systemic arterial blood. Using some kind of oxygen meter, the rate of oxygen absorption by the lungs is determined by the rate of oxygen disappearance from the respired air.
Measuring CO by Indicator Diluting Method
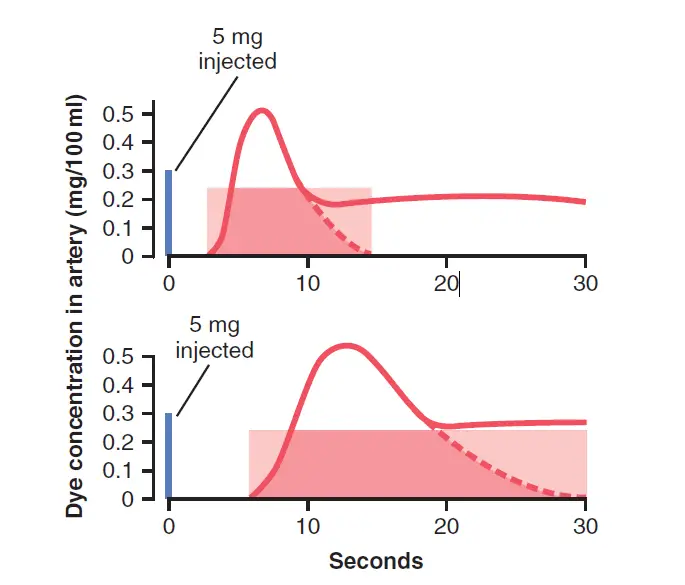
To calculate cardiac output by the “indicator dilution method,” a small amount of indicator, such as a dye, is injected into a large systemic vein or, ideally, into the right atrium. This indicator travels quickly through the right side of the heart, then through the lungs’ blood vessels, the left side of the heart, and eventually through the systemic arterial system. The concentration of the dye is measured as it passes through one of the peripheral arteries, resulting in the curve portrayed in image.
In each of these cases, 5 milligrams of Cardiogreen dye were injected at the start of the experiment. In the top recording, none of the dye entered the arterial tree until about 3 seconds after the injection, but then the arterial concentration of the dye rapidly increased to a maximum in about 6 to 7 seconds. After that, the concentration fell quickly, but some of the dye had already circulated all the way through some of the peripheral systemic vessels and returned through the heart for a second time.
As a result, the dye concentration in the artery started to increase once more. For the purpose of measurement, it is important to extrapolate the early down-slope of the curve to the zero point, as shown by the dashed portion of each curve.
The extrapolated time-concentration curve of the dye in the systemic artery without recirculation can thus be calculated in its first portion and relatively reliably estimated in its latter portion.
Once the extrapolated time-concentration curve has been determined, the mean concentration of dye in arterial blood for the length of the curve is calculated. For example, in the top example of Figure 20-20, this calculation was performed by measuring the area under the entire initial and extrapolated curve and then averaging the concentration of dye for the duration of the curve; the shaded rectangle straddling the curve in the upper figure shows that the average concentration of dye was 0.25 mg/dl of blood and that the duration of this average was 0.25 minutes. At the start of the experiment, 5 milligrams of dye had been injected.
To bring the entire 5 milligrams of dye through the heart and lungs in 12 seconds, blood carrying just 0.25 milligram of dye in every 100 milliliters would have passed through the heart in 20 sections, each with 100 milliliters of blood, resulting in cardiac output of 2 L/12 sec, or 10 L/min. We will leave it to the reader to measure the cardiac output from the figure’s bottom extrapolated curve.
By Indicator Duluting method the calculation of CO is;
Cardiac Output (ml/min) = (amount of milligram of dye injected × 60) / (Average concentration of dye in each milliliter of blood for the duration of the curve) × (Duration of the curve in seconds)
Measurement of Body Surface Area(BSA)
Although there are several methods for measuring the BSA, the Mosteller formula is one of the most widely used. BSA = The square root of [bodyweight (kg) x height (cm) / (3600)]. Adult males have a BSA of 1.9, while adult females have a BSA of 1.6. A cellular phone application can now be used to measure a patient’s body surface area; however, care must be taken to ensure that the correct equation is chosen for the situation and patient.
Clinical Points of Cardiac Index
The clinical importance of the cardiac index arises from the fact that it is a measure of cardiac function that can be normalized for the patient’s body habitus, allowing the clinician to gain critical insight into the patient’s heart function across differences in body form. Given these objective criteria, physicians must often make decisions on drugs, treatment choices, and educating patients on prognosis. Bedside echocardiogram monitoring, for example, in patients with septic shock, can help direct the administration of vasopressors and/or dilators to specific patients. The cardiac index’s strength is that it is a number that includes a more accurate picture of how the heart functions in relation to the rest of the body, rather than individually.
The cardiac index is a hemodynamic test used to assess the various types of shock (circulatory disorders that lead to poor tissue perfusion). Shock can be classified into four types:
- Cardiogenic: underlying heart disease (for example, myocardial infarction, arrhythmias, heart failure, cardiomyopathy, myocarditis, or extreme mitral/aortic regurgitation).
- Obstructive: a blockage of the heart or its major arteries (e.g., as a result of cardiac tamponade, massive pulmonary embolism, or tension pneumothorax)
- Hypovolemia: It is described as a decrease in intravascular blood volume (e.g., as a result of hemorrhage or non-hemorrhagic fluid loss [diarrhea, vomiting, burns, third spacing, diuresis, adrenal insufficiency])
- Distributive (e.g., septic or anaphylactic shock): transfer of body fluid as a result of vasodilation with or without capillary leakage
In cardiogenic, obstructive, and hypovolemic shock, one would expect to see a drop in cardiac index. In comparison, in septic and anaphylactic shock, the cardiac index is normally average to slightly elevated.
Last Updated on February 23, 2022 by Learn From Doctor Team


