Table of Contents
Venous Return(VR) Overview
Venous return(VR) is the flow of blood from the periphery back to the right atrium, and it is exactly the same as the cardiac output except for brief periods. Since clinicians and researchers have long observed that factors affecting predominantly the venous side of the circulation can have a significant impact on cardiac function, mechanisms regulating blood flow to the heart have been thoroughly studied. However, a complete comprehension of the venous side has been difficult due to the complexity of some of its characteristics.
Curves of Venous Return
Before a complete study of cardiac function, as well as the venous return, can be done, the entire systemic circulation must be considered. To investigate the role of systemic circulation, we first remove the heart and lungs from an animal’s circulation and replace them with a pump and an artificial oxygenator system. Then, various variables such as blood flow, vascular resistances, and central venous pressure in the right atrium are altered to decide how the systemic circulation works in various circulatory states.
These studies reveal the following three major factors that influence venous return to the heart from systemic circulation.
Major Factors Influencing the VR
- Right atrial pressure is a force exerted on the veins that prevent blood from flowing from the veins into the right atrium.
- The degree to which the systemic circulation is filled (as determined by the mean systemic filling pressure), which pushes the systemic blood into the heart (this is the pressure measured everywhere in the systemic circulation when all blood flow is halted.
- Blood flow resistance between the peripheral arteries and the right atrium.
The venous return curve will quantitatively represent all of these variables.
The Curve of Normal VR
Similarly to how the cardiac output curve relates heart pumping to right atrial pressure, the venous return curve relates venous return to right atrial pressure—that is, the venous flow of blood into the heart from the systemic circulation at various levels of right atrial pressure.
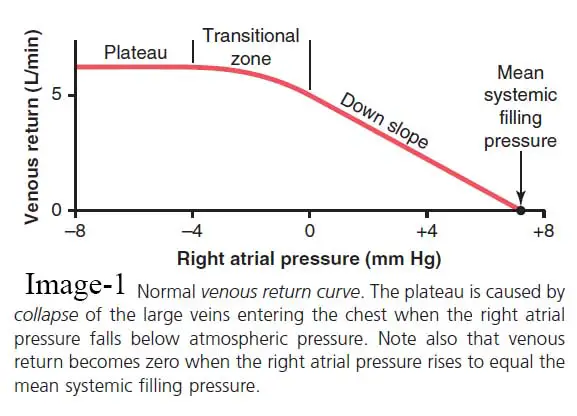
The image showing the usual venous return curve. This curve demonstrates that when the heart’s pumping capacity deteriorates, causing the right atrial pressure to increase, the backward force of the rising atrial pressure on the veins of the systemic circulation reduces venous return to the heart. As the right atrial pressure increases to about +7 mm Hg and all nervous circulatory reflexes are inhibited, the venous return drops to zero. Since any increase in back pressure causes blood to dam up in the systemic circulation rather than returning to the heart, even a small increase in right atrial pressure causes a dramatic decrease in venous return.
At the same moment, as right atrial pressure rises, causing venous stasis, heart-pumping reaches zero due to decreased venous return.
When all flow in the systemic circulation ceases at a pressure of 7 mm Hg, which is described as the mean systemic filling pressure, both arterial and venous pressures reach equilibrium.
Plateau in the Venous Return Curve at Negative Atrial Pressures Usually Caused by Large Vein Collapse
As the right atrial pressure falls below zero, or below atmospheric pressure, the rise in venous return almost stops, and by the time the right atrial pressure has dropped to around 2 mm Hg, the venous return has reached a plateau. Even if the right atrial pressure drops to 20 mm Hg, 50 mm Hg, or even lower, it stays at this plateau level. The collapse of the veins entering the chest causes this plateau. Negative pressure in the right atrium sucks the vein walls together where they meet the lung, preventing any further blood flow from the peripheral veins. As a result, even very negative pressures in the right atrium cannot substantially increase venous return above what occurs at a typical atrial pressure of 0 mm Hg.
Effect of Mean Circulatory Filling Pressure Mean Systemic Filling Pressure on VR
When heart pumping is stopped(ceased), whether by shaking the heart with electricity to induce ventricular fibrillation or in some other way, blood flow throughout the circulation stops a few seconds later. When there is no blood supply, the pressures in the circulation become equal.
The mean circulatory filling pressure is this equilibrated pressure level.
Relation Between Blood Volume And Mean Circulatory Filling Pressure.
Since extra blood volume stretches the walls of the vasculature, the mean circulatory filling pressure rises as the volume of blood in circulation rises. The red curve in the picture represents the estimated normal effect of various blood volume levels on the mean circulatory filling pressure.
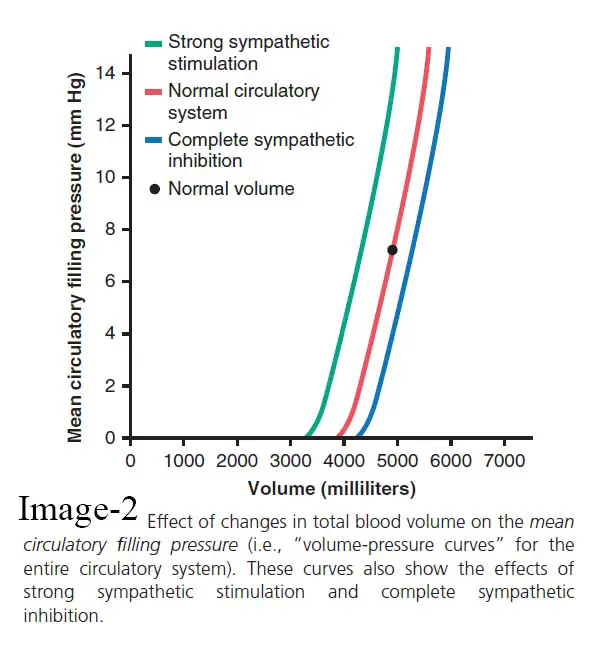
The mean circulatory filling pressure is equivalent to zero at a blood volume of around 4000 milliliters since this is the “unstressed volume” of the circulation, but at a volume of 5000 milliliters, the filling pressure is the usual value of 7 mm Hg. Similarly, at higher volumes, the mean circulatory filling pressure almost linearly increases.
Relation Between Sympathetic Nervous Stimulation And Mean Circulatory Filling Pressure.
The green and blue curves in the picture(image-2) represent the effects of high and low levels of sympathetic nervous activity on mean circulatory filling pressure, respectively. Strong sympathetic stimulation constricts all systemic blood vessels as well as the wider pulmonary blood vessels and even the heart chambers. As a result, the system’s capacity decreases, and the mean circulatory filling pressure rises with each level of blood volume. At normal blood volume, maximal sympathetic stimulation raises the mean circulatory filling pressure from 7 mm Hg to approximately 2.5 times that amount, or approximately 17 mm Hg.
In contrast, full suppression of the sympathetic nervous system relaxes both the blood vessels and the heart, lowering the mean circulatory filling pressure from 7 mm Hg to about 4 mm Hg. The steepness of the curves in the picture indicates that even minor changes in blood volume or system ability caused by different levels of sympathetic activity can have a significant impact on the mean circulatory filling pressure.
Relation Between Mean Systemic Filling Pressure And Mean Circulatory Filling Pressure
The mean systemic filling pressure (Psf) differs significantly from the mean circulatory filling pressure. It is the pressure determined in the systemic circulation after blood flow has been stopped by clamping the large blood vessels at the heart, allowing pressures throughout the systemic circulation to be measured independently of pressures throughout the pulmonary circulation. Although it is almost difficult to calculate in a living animal, the mean systemic filling pressure is almost always nearly equal to the mean circulatory filling pressure since the pulmonary circulation has less than one-eighth the capacitance of the systemic circulation and just around one-tenth the blood volume.
Effect of Changes in Mean Systemic Filling Pressure on VR
The image represents the impact of rising or decreasing Psf on the venous return curve. It should be noted that the standard Psf is 7 mm Hg. Psf was then raised to 14 mm Hg for the uppermost curve in the figure and decreased to 3.5 mm Hg for the lowermost curve. These curves show that as Psf increases (which also increases the “tightness” with which the circulatory system is filled with blood), the venous return curve moves upward and to the right. Conversely, as the Psf decreases, the curve shifts downward and to the left.
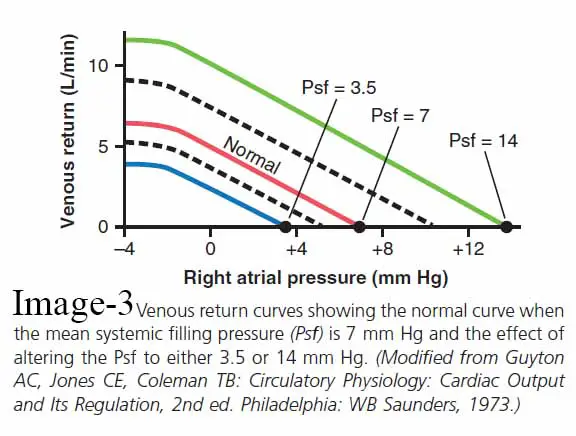
To put it another way, the higher the level of filling in the system, the simpler it is for blood to flow into the heart. The lower the level of filling in the system, the more difficult it is for blood to flow into the heart.
Pressure Gradient and VR
When the right atrial pressure equals the Psf, the pressure differential between the peripheral vessels and the right atrium disappears. As a result, there can be no blood supply from peripheral arteries back to the right atrium. However, as the right atrial pressure falls below the Psf, blood flow to the heart increases proportionally, as shown by either of the venous return curves in the picture. In other words, the greater the difference between Psf and right atrial strain, the greater the venous return. As a result, the difference between these two pressures is referred to as the pressure gradient for venous return.
Venous Return Resistance
Psf reflects a pressure driving venous blood from the periphery toward the heart, but there is also resistance to this venous flow of blood.
It is known as venous return resistance. The majority of venous return resistance occurs in the veins, though some occur in the arterioles and small arteries as well.
Why is venous resistance so critical in deciding venous return resistance? The response is that as vein resistance rises, blood starts to congeal, mostly in the veins themselves. However, since the veins are extremely distensible, the venous pressure increases very slowly. As a result, the increase in venous pressure is ineffective in overcoming resistance, and blood flow into the right atrium decreases dramatically.
As the resistances of the arteriolar and small arteries rise, blood accumulates in the arteries, which have a capacitance one-thirtieth that of the veins.
As a result, even minor blood accumulation in the arteries increases pressure significantly—30 times that of the veins—and this elevated pressure overcomes most of the increased resistance. Mathematically, venous resistance accounts for about two-thirds of the so-called “resistance to venous return,” with arteriolar and small artery resistance responsible for the remaining one-third.
Calculation of Venous Return (VR) = (Psf-PRA)/RVR
Here,
Psf = Mean systemic filling pressure
PRA= Right arterial pressure
RVR= Resistance to venous return
The values for these are as follows in a healthy human adult: venous return equals 5 L/min, Psf equals 7 mm Hg, right atrial pressure equals 0 mm Hg, and resistance to venous return equals 1.4 mm Hg per L/min of blood flow.
Effect of RVR on VR Curve
The image(image-6) shows the effect of various levels of venous return resistance on the venous return curve, demonstrating that lowering this resistance to one-half normal makes twice as much blood flow and, as a result, rotates the curve upward to twice as steep a slope. In contrast, increasing the resistance to twice average rotates the curve downward to half the slope.
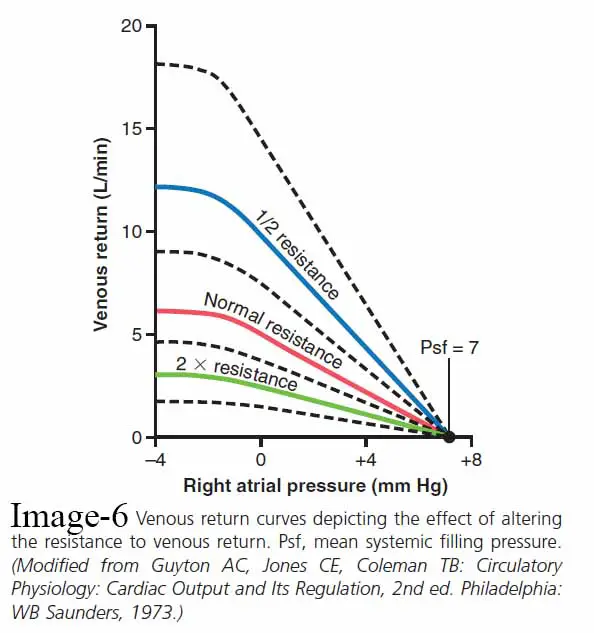
It is also worth mentioning that when the right atrial pressure increases to match the Psf, venous return becomes zero at all levels of venous return resistance so there is no pressure gradient to cause blood flow. As a result, regardless of how often the heart fails, the maximum amount to which the right atrial pressure will rise is equal to the Psf.
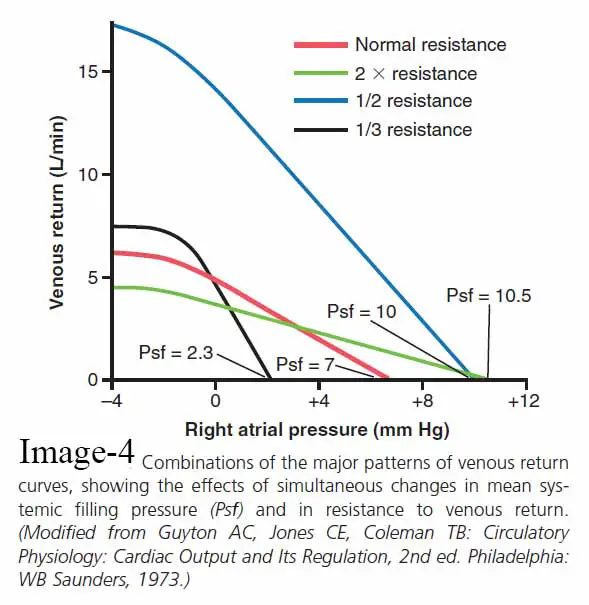
The image(image-4) shows the impact on the venous return curve caused by concurrent changes in Psf and resistance to venous return, showing that both of these variables can function concurrently.
VR Curve and Cardiac Output
The heart and the systemic circulation must pair up to ensure full circulation. This stipulation implies that
- The systemic circulation’s venous return must match the heart’s cardiac output.
- Both the heart and the systemic circulation have the same right atrial pressure.
As a result, the cardiac output and right atrial pressure can be predicted as follows:
- Determine the heart’s momentary pumping capacity and represent it in the form of a cardiac output curve.
- determine the momentary state of flow from the systemic circulation into the heart and represent this state of flow as a venous return curve
As seen in the picture, these curves are “equated” against one another.
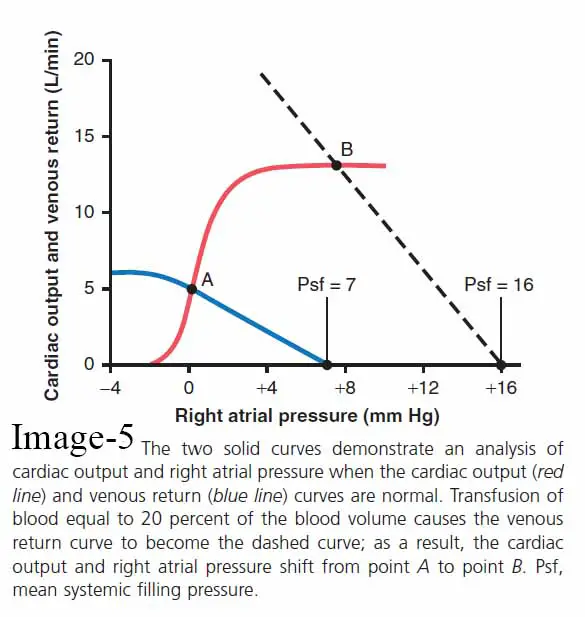
The image depicts two curves: the normal cardiac output curve (red line) and the normal venous return curve (blue line). On the graph, there is only one point, point A, where the venous return equals the cardiac output and the right atrial pressure is the same for both the heart and the systemic circulation. As a result, in normal circulation, the right atrial pressure, cardiac output, and venous return are all depicted by point A, known as the equilibrium point, with a normal cardiac output of 5 L/min and a right atrial pressure of 0 mm Hg.
Read Cardiac Glycosides
Venous Return Summary
Venous return and, as a result, cardiac output are functions of the venous return pressure gradient and the number of the resistances of the arterial and venous parts. Factors that increase or decrease mean systemic pressure and/or right atrial pressure have an effect on the pressure gradient. Factors that cause changes in smooth muscle tone of resistance vessels or changes in pressure in the tissue surrounding thin-walled venous structures influence venous return resistance.
Last Updated on February 23, 2022 by Learn From Doctor Team


